
You spent $8,000 on Google Ads last month. The phone rang a lot. You closed some jobs. But did you actually make money on that marketing spend?
Most home service business owners can't answer that question with confidence. They know they're spending on marketing. They have a vague sense of whether it's "working." But they don't know the actual return on investment—which channels produce profitable customers and which ones drain money.
Without clear ROI measurement, you're guessing with your marketing budget. And guessing usually means overspending on underperforming channels while underfunding the ones that actually work.
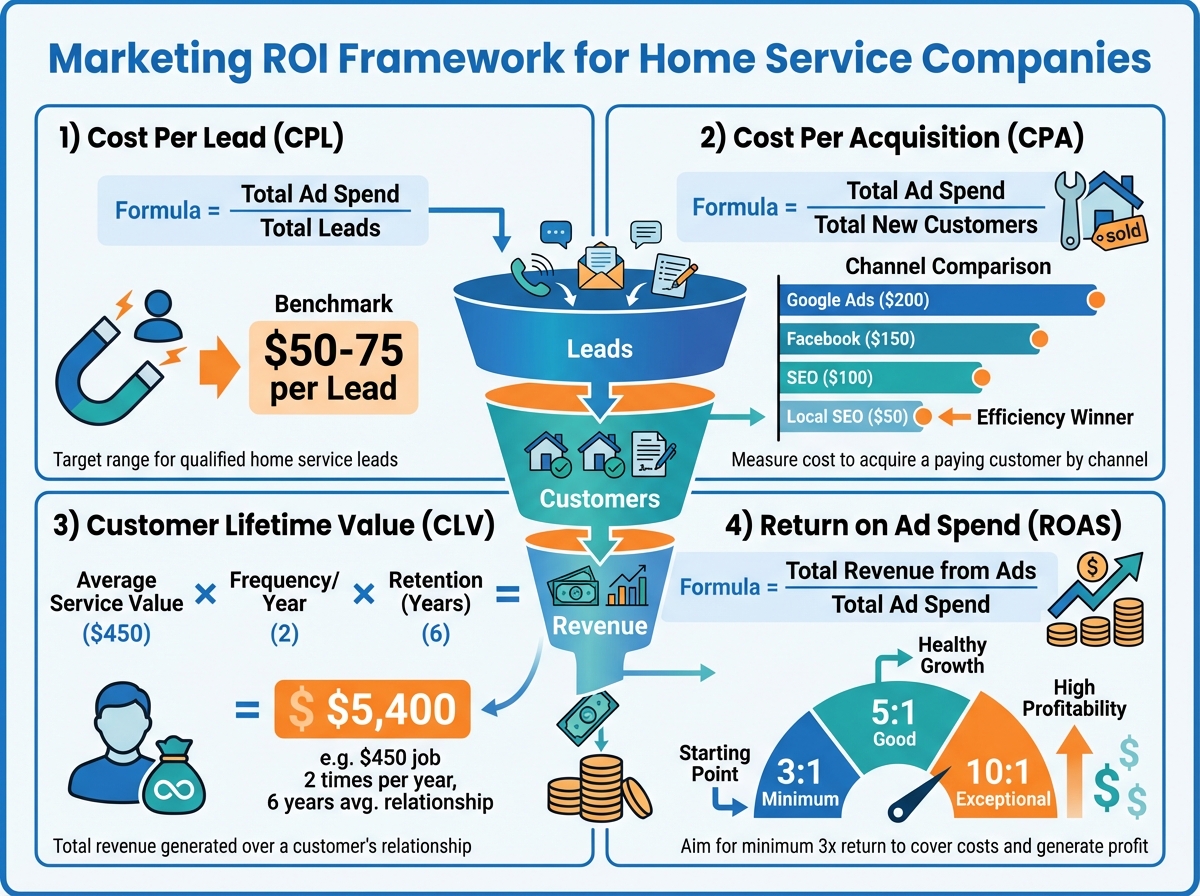
TL;DR: Marketing ROI for home service companies requires tracking four key metrics: cost per lead (CPL), cost per acquisition (CPA), customer lifetime value (CLV), and return on ad spend (ROAS). Most contractors find 30-50% of their marketing spend goes to channels with negative ROI. Proper tracking typically reveals 2-3 channels worth doubling down on and 2-3 worth cutting entirely.
The contractors who dominate their markets aren't necessarily spending more on marketing—they're measuring better and reallocating to what works.
Why Marketing ROI Matters for Contractors
Every dollar has an opportunity cost. Money spent on ineffective marketing can't be spent on effective marketing—or on trucks, tools, or talent.
The measurement gap:
| Business Size | Measure Marketing ROI | Don't Measure |
|---|---|---|
| Under $500K revenue | 12% | 88% |
| $500K-$2M revenue | 34% | 66% |
| $2M-$5M revenue | 58% | 42% |
| Over $5M revenue | 81% | 19% |
There's a reason larger companies measure ROI—it's how they got larger.
What happens without measurement:
- Money flows to whoever sells hardest, not what works best
- Seasonal patterns confuse marketing effectiveness
- Successful campaigns get cut alongside failures
- Marketing budget becomes political, not strategic
- Growth plateaus despite increased spending
What measurement enables:
- Double down on high-ROI channels
- Cut money-losing campaigns confidently
- Test new channels with clear success criteria
- Budget based on expected returns, not feelings
- Scale profitably instead of just spending more
The Four Essential Marketing Metrics
You don't need complex analytics. You need four numbers, tracked consistently.
Metric 1: Cost Per Lead (CPL)
What it measures: How much you spend to generate one inquiry.
Formula:
CPL = Marketing Spend ÷ Number of Leads Generated
Example:
- Google Ads spend: $3,000/month
- Leads generated: 45
- CPL = $3,000 ÷ 45 = $66.67 per lead
Benchmark CPL by channel:
| Channel | Low CPL | Average CPL | High CPL |
|---|---|---|---|
| Google Ads | $25 | $75 | $150+ |
| Facebook Ads | $15 | $45 | $100+ |
| LSA (Google Local Services) | $20 | $50 | $100+ |
| SEO (organic) | $5 | $20 | $50 |
| Referrals | $0-10 | $15 | $30 |
| Direct mail | $30 | $80 | $200+ |
Why CPL alone isn't enough:
A $20 lead that never converts is worse than a $100 lead that closes. CPL tells you efficiency, not effectiveness.
Metric 2: Cost Per Acquisition (CPA)
What it measures: How much you spend to acquire one paying customer.
Formula:
CPA = Marketing Spend ÷ Number of New Customers
Example:
- Google Ads spend: $3,000/month
- Leads generated: 45
- Customers closed: 12
- CPA = $3,000 ÷ 12 = $250 per customer
CPA vs. CPL comparison:
| Channel | CPL | Close Rate | CPA |
|---|---|---|---|
| Google Ads | $67 | 27% | $248 |
| Facebook Ads | $35 | 15% | $233 |
| SEO | $20 | 35% | $57 |
| Referrals | $10 | 55% | $18 |
Notice how Facebook has lower CPL but similar CPA due to lower close rates. CPL can mislead—CPA tells the real story.
Acceptable CPA depends on job value:
| Service Type | Average Job Value | Target CPA | Max CPA |
|---|---|---|---|
| Service call | $250 | $25-50 | $75 |
| Repair | $800 | $80-120 | $200 |
| Replacement | $8,000 | $400-800 | $1,200 |
| New construction | $25,000 | $1,000-2,000 | $3,500 |
Metric 3: Customer Lifetime Value (CLV)
What it measures: Total revenue from a customer over their entire relationship.
Simple formula:
CLV = Average Job Value × Purchase Frequency × Customer Lifespan
Example:
- Average job value: $450
- Purchases per year: 1.5
- Customer lifespan: 8 years
- CLV = $450 × 1.5 × 8 = $5,400
Why CLV changes everything:
Without CLV, a $400 CPA for a $500 repair looks marginal. With CLV, that same $400 acquisition cost for a $5,400 lifetime customer looks excellent.
CLV by customer type:
| Customer Type | Initial Job | Lifetime Value | CPA Tolerance |
|---|---|---|---|
| One-time service | $300 | $300 | $50-75 |
| Maintenance customer | $200/year | $2,000 | $200-400 |
| Full-service relationship | $800/year | $8,000+ | $800-1,500 |
How to increase CLV:
- Maintenance agreements (increases frequency)
- Excellent service (increases lifespan)
- Multi-service offerings (increases value)
- Regular communication (increases frequency)
Metric 4: Return on Ad Spend (ROAS)
What it measures: Revenue generated per dollar of marketing spend.
Formula:
ROAS = Revenue from Campaign ÷ Marketing Spend
Example:
- Google Ads spend: $3,000
- Revenue from Google Ads customers: $18,000
- ROAS = $18,000 ÷ $3,000 = 6:1 (or 600%)
ROAS benchmarks:
| ROAS | Interpretation | Action |
|---|---|---|
| Under 2:1 | Losing money (after costs) | Cut or fix |
| 2:1 - 3:1 | Breaking even | Optimize |
| 3:1 - 5:1 | Profitable | Maintain |
| 5:1 - 10:1 | Highly profitable | Scale |
| Over 10:1 | Exceptional | Scale aggressively |
Important: ROAS should account for gross margin, not just revenue. A 4:1 ROAS with 40% margins means $1.60 profit per $1 spent. A 4:1 ROAS with 25% margins means $1.00 profit per $1 spent.
Setting Up Marketing Attribution
You can't calculate ROI without knowing which marketing channel produced each customer.
Lead Source Tracking
For phone calls:
- Use unique tracking numbers per channel
- Google Ads: One number
- Facebook: Different number
- Direct mail: Different number
- Website organic: Different number
For form submissions:
- Hidden fields capturing UTM parameters
- Source tracking in CRM
- Landing page identification
For walk-ins/referrals:
- "How did you hear about us?" question
- Train staff to ask and record
- Make it a required field
Attribution Models
First-touch attribution: Credits the first marketing touchpoint.
- Pro: Simple, clear
- Con: Ignores nurturing impact
Last-touch attribution: Credits the final touchpoint before conversion.
- Pro: Shows what closed the deal
- Con: Ignores awareness impact
Multi-touch attribution: Distributes credit across touchpoints.
- Pro: More accurate
- Con: Complex to implement
Recommendation for most contractors: Start with last-touch attribution (it's simple and actionable). Move to multi-touch as you get more sophisticated.
CRM Requirements for ROI Tracking
Your contractor CRM needs these fields:
| Field | Purpose |
|---|---|
| Lead source | Primary attribution |
| Campaign/medium | Granular tracking |
| First contact date | Speed to lead metrics |
| Close date | Sales cycle tracking |
| Job value | Revenue attribution |
| Customer type | CLV segmentation |
Calculating ROI by Marketing Channel
Let's walk through ROI calculation for common channels.
Google Ads ROI Example
Monthly data:
- Spend: $4,500
- Leads: 58
- Customers: 16
- Revenue: $22,400
- Gross margin: 42%
Calculations:
- CPL: $4,500 ÷ 58 = $77.59
- CPA: $4,500 ÷ 16 = $281.25
- ROAS: $22,400 ÷ $4,500 = 4.98:1
- Gross profit: $22,400 × 42% = $9,408
- Net marketing profit: $9,408 - $4,500 = $4,908
- ROI: $4,908 ÷ $4,500 = 109%
Verdict: Profitable. Consider scaling.
Facebook Ads ROI Example
Monthly data:
- Spend: $2,000
- Leads: 72
- Customers: 8
- Revenue: $5,600
- Gross margin: 42%
Calculations:
- CPL: $2,000 ÷ 72 = $27.78
- CPA: $2,000 ÷ 8 = $250
- ROAS: $5,600 ÷ $2,000 = 2.8:1
- Gross profit: $5,600 × 42% = $2,352
- Net marketing profit: $2,352 - $2,000 = $352
- ROI: $352 ÷ $2,000 = 17.6%
Verdict: Marginally profitable. Optimize before scaling.
SEO/Organic ROI Example
Monthly data:
- Spend: $1,500 (content + technical SEO)
- Leads: 85
- Customers: 32
- Revenue: $28,800
- Gross margin: 42%
Calculations:
- CPL: $1,500 ÷ 85 = $17.65
- CPA: $1,500 ÷ 32 = $46.88
- ROAS: $28,800 ÷ $1,500 = 19.2:1
- Gross profit: $28,800 × 42% = $12,096
- Net marketing profit: $12,096 - $1,500 = $10,596
- ROI: $10,596 ÷ $1,500 = 706%
Verdict: Exceptional. Invest more in SEO.
Referral Program ROI Example
Monthly data:
- Spend: $500 (referral rewards)
- Leads: 22
- Customers: 14
- Revenue: $16,800
- Gross margin: 42%
Calculations:
- CPL: $500 ÷ 22 = $22.73
- CPA: $500 ÷ 14 = $35.71
- ROAS: $16,800 ÷ $500 = 33.6:1
- Gross profit: $16,800 × 42% = $7,056
- Net marketing profit: $7,056 - $500 = $6,556
- ROI: $6,556 ÷ $500 = 1,311%
Verdict: Best performing channel. Systematize and scale.
Building Your Marketing ROI Dashboard
Track these metrics monthly to spot trends.
Monthly Tracking Template
| Channel | Spend | Leads | CPL | Customers | CPA | Revenue | ROAS | ROI |
|---|---|---|---|---|---|---|---|---|
| Google Ads | $4,500 | 58 | $78 | 16 | $281 | $22,400 | 4.98 | 109% |
| $2,000 | 72 | $28 | 8 | $250 | $5,600 | 2.80 | 18% | |
| SEO | $1,500 | 85 | $18 | 32 | $47 | $28,800 | 19.2 | 706% |
| Referrals | $500 | 22 | $23 | 14 | $36 | $16,800 | 33.6 | 1311% |
| Total | $8,500 | 237 | $36 | 70 | $121 | $73,600 | 8.66 | 263% |
Trend Analysis
Track month-over-month changes:
| Metric | Jan | Feb | Mar | Trend |
|---|---|---|---|---|
| Total CPL | $42 | $38 | $36 | ↓ Improving |
| Total CPA | $145 | $132 | $121 | ↓ Improving |
| Blended ROAS | 6.2 | 7.4 | 8.66 | ↑ Improving |
Red Flags to Watch
| Warning Sign | Possible Cause | Action |
|---|---|---|
| CPL rising, close rate stable | Channel fatigue or competition | Test new creative/audiences |
| CPL stable, close rate falling | Lead quality declining | Adjust targeting |
| ROAS declining across all channels | Market conditions or pricing | Review pricing strategy |
| One channel suddenly worse | Platform changes or competition | Investigate immediately |
Optimizing Based on ROI Data
Once you have data, act on it.
Budget Reallocation Framework
Step 1: Rank channels by ROI
| Rank | Channel | ROI | Current Budget | Recommendation |
|---|---|---|---|---|
| 1 | Referrals | 1,311% | $500 | Increase 3x |
| 2 | SEO | 706% | $1,500 | Increase 2x |
| 3 | Google Ads | 109% | $4,500 | Maintain |
| 4 | 18% | $2,000 | Reduce 50% |
Step 2: Reallocate budget
| Channel | Old Budget | New Budget | Change |
|---|---|---|---|
| Referrals | $500 | $1,500 | +$1,000 |
| SEO | $1,500 | $3,000 | +$1,500 |
| Google Ads | $4,500 | $4,500 | $0 |
| $2,000 | $1,000 | -$1,000 | |
| Total | $8,500 | $10,000 | +$1,500 |
Projected impact: Higher total ROI with only modest budget increase.
Testing New Channels
When testing a new marketing channel:
- Set a test budget: 10-15% of monthly marketing spend
- Define success criteria: Target CPA and ROAS before starting
- Run for 60-90 days: Enough data to evaluate
- Measure against criteria: Pass/fail based on pre-set targets
- Scale or cut: No middle ground after test period
Optimization Tactics by Channel
Google Ads optimization:
- Negative keywords to reduce waste
- Ad copy testing for higher CTR
- Landing page optimization for conversion
- Bid adjustments by time/location/device
Facebook optimization:
- Audience refinement based on converters
- Creative testing (video vs. image)
- Retargeting warm audiences
- Lookalike audiences from best customers
SEO optimization:
- Content targeting high-intent keywords
- Local SEO for "near me" searches
- Review generation for local pack
- Technical site speed improvements
Common ROI Measurement Mistakes
Avoid these errors that skew your data.
Mistake 1: Ignoring Offline Conversions
Problem: Only tracking online form fills, missing phone calls.
Solution: Call tracking with unique numbers per channel. Phone calls often represent 60-70% of home service leads.
Mistake 2: Attribution Gaps
Problem: "How did you hear about us?" → "The internet."
Solution: Train staff on specific questions. Require source capture before creating lead record.
Mistake 3: Short Measurement Windows
Problem: Judging a campaign after two weeks.
Solution: Most home service buying cycles are 2-8 weeks. Measure over 60-90 day windows minimum.
Mistake 4: Ignoring Lifetime Value
Problem: Cutting a channel because first-job ROI is low.
Solution: Factor in CLV. A maintenance agreement customer acquired at $300 CPA might be worth $5,000+ over time.
Mistake 5: Not Accounting for Seasonality
Problem: Comparing January to July and thinking marketing got worse.
Solution: Compare year-over-year, not month-over-month. Seasonal businesses need seasonal benchmarks.
Tools for Marketing ROI Tracking
You don't need expensive enterprise software.
Essential Tools
| Tool Category | Options | Monthly Cost |
|---|---|---|
| Call tracking | CallRail, CallTrackingMetrics | $30-100 |
| CRM with source tracking | TruLine, Housecall Pro, Jobber | $50-200 |
| Google Analytics | GA4 (free) | $0 |
| Spreadsheet | Google Sheets, Excel | $0-12 |
Nice-to-Have Tools
| Tool Category | Options | Monthly Cost |
|---|---|---|
| Marketing dashboard | Databox, AgencyAnalytics | $50-200 |
| Attribution platform | Ruler Analytics, WhatConverts | $100-400 |
| Competitive intelligence | SpyFu, SEMrush | $100-200 |
Build vs. Buy
Build your own (spreadsheet):
- Pros: Free, customizable, no learning curve
- Cons: Manual updates, error-prone, limited visualization
Buy a dashboard:
- Pros: Automated, visual, shareable
- Cons: Cost, setup time, may not fit your exact needs
Recommendation: Start with spreadsheets to understand your metrics. Graduate to automated tools as you scale.
Frequently Asked Questions
How often should I review marketing ROI?
Monthly for channel-level metrics, weekly for campaign-level if you're actively optimizing. Don't make major decisions on less than 30 days of data. Quarterly reviews are appropriate for budget reallocation decisions.
What's a good marketing ROI for home services?
Target 3:1 ROAS minimum (300% return) after accounting for cost of goods sold. Top performers achieve 5:1 to 10:1. Below 2:1 typically means losing money after all costs. These benchmarks assume 35-45% gross margins typical in home services.
Should I track ROI myself or hire someone?
Start by tracking yourself—you'll understand your business better. As you grow past $1M revenue, consider a marketing coordinator or agency that reports on ROI metrics. Never outsource the understanding of ROI, only the execution and reporting.
Take Control of Your Marketing Spend
Marketing ROI measurement transforms marketing from a cost center to a profit driver. The contractors who measure, optimize, and reallocate based on data consistently outperform those who guess.
Key takeaways:
- Track four metrics: CPL, CPA, CLV, and ROAS
- Set up proper attribution before spending more
- Calculate ROI by channel, not just total
- Reallocate budget from low to high performers
- Measure over 60-90 day windows minimum
The goal isn't to spend less on marketing—it's to spend smarter. With proper ROI tracking, every dollar you invest works harder, and scaling becomes a math problem instead of a gamble.
Ready to track marketing ROI alongside your sales metrics? Start your free trial with TruLine and see which channels actually drive revenue.


