
Your phone rings constantly during peak season. Twenty new leads today—but you can only run ten appointments. Which ones do you prioritize? The Facebook lead who wants "just a quote"? The Google search lead asking about emergency service? The referral from your best customer?
Without a system, you guess. Sometimes you're lucky and pick winners. Other times, your best technicians waste afternoons on price-shoppers while high-intent buyers go to competitors who called back faster.
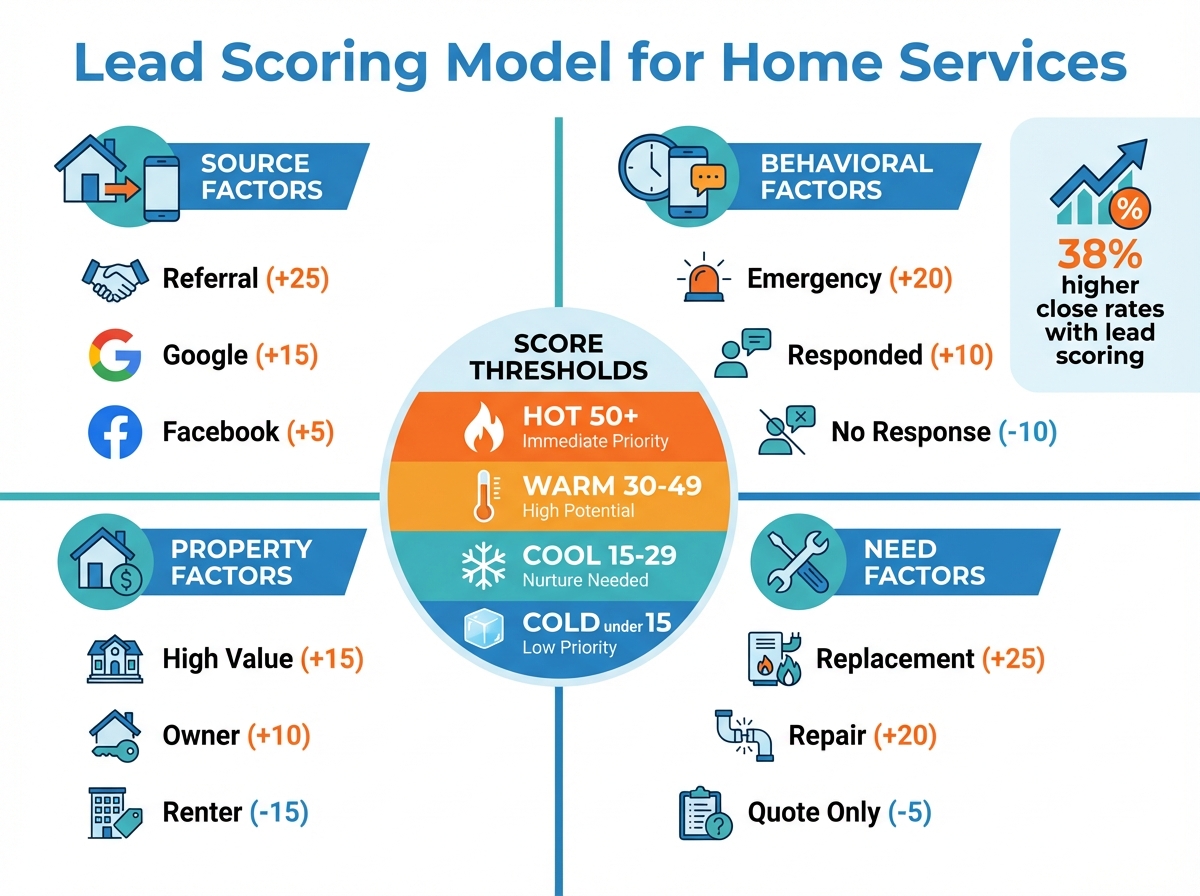
TL;DR: Lead scoring assigns point values to lead characteristics that predict conversion, allowing home service companies to prioritize the opportunities most likely to close at the highest values. Companies using lead scoring report 38% higher close rates, 27% faster response times to high-value leads, and 45% better sales team productivity by focusing effort where it matters most.
The right home service CRM automates lead scoring based on your historical data. But you need to understand what makes a lead valuable before the system can score them. Here's how to build lead scoring that works for contractors.
What Is Lead Scoring?
Lead scoring assigns numerical values to leads based on characteristics that predict conversion. Higher scores indicate leads more likely to buy.
Simple example:
| Lead Characteristic | Points |
|---|---|
| Came from referral | +25 |
| Requested emergency service | +20 |
| Owns home (vs. renting) | +15 |
| Property value >$400K | +15 |
| Responded to follow-up | +10 |
| From Google search | +10 |
| From Facebook ad | +5 |
| Only wants quote | -10 |
| Requested lowest price | -15 |
Lead A: Referral + homeowner + responded to follow-up = 50 points Lead B: Facebook ad + only wants quote = -5 points
Which one should your sales team call first?
Lead scoring transforms subjective gut feelings into objective prioritization. Your team stops debating which leads to call and starts closing the ones that matter.
Why Lead Scoring Matters for Home Services
Home service businesses face unique lead prioritization challenges.
The contractor's dilemma:
- Limited technicians to run appointments
- Seasonality creates lead surges
- High cost per lead requires maximizing conversion
- Speed-to-lead dramatically affects close rates
- Not all leads are created equal
Without lead scoring:
| Scenario | Result |
|---|---|
| First-come, first-served | Best leads buried under junk leads |
| Sales rep picks favorites | Inconsistent, bias-driven prioritization |
| Owner makes all decisions | Bottleneck limits response speed |
| Round-robin assignment | Best reps waste time on weak leads |
With lead scoring:
- High-score leads get immediate response
- Best closers work highest-value opportunities
- Low-score leads get appropriate (lower) investment
- Team productivity increases without adding headcount
- Close rates improve through better prioritization
The data proves it: companies with lead scoring convert 30% more leads than those without—not because they're better at selling, but because they're better at choosing who to sell to.
Building Your Lead Scoring Model
Effective lead scoring combines four factor categories.
Factor 1: Lead Source Scoring
Where leads come from predicts conversion quality.
| Source | Typical Conversion Rate | Suggested Points |
|---|---|---|
| Customer referral | 45-60% | +25 to +30 |
| Google search (branded) | 35-50% | +20 |
| Google search (service) | 25-40% | +15 |
| Home advisor/Angi | 15-25% | +10 |
| Facebook ad | 8-15% | +5 |
| Door hanger/mailer | 5-12% | +5 |
| Cold lead list | 2-5% | 0 |
How to calibrate for your business:
- Pull 12 months of closed deals
- Group by lead source
- Calculate conversion rate per source
- Assign points proportional to conversion rate
Your numbers may differ from the table. A referral-heavy business might see even higher referral conversion. A company with great Facebook targeting might see social leads convert better than average.
Factor 2: Behavioral Scoring
What leads do indicates their intent level.
| Behavior | What It Signals | Suggested Points |
|---|---|---|
| Requested emergency service | Urgent need, will buy fast | +20 |
| Scheduled appointment online | High commitment | +15 |
| Responded to follow-up call | Engaged and accessible | +10 |
| Opened email multiple times | Active consideration | +10 |
| Visited pricing page | Ready to evaluate | +10 |
| Downloaded guide/resource | Researching, may need nurture | +5 |
| Visited site but no action | Interested but not ready | +5 |
| No response to 2+ attempts | Disengaged | -10 |
| Canceled scheduled appointment | Low commitment | -15 |
Real-time behavioral scoring:
Modern CRMs track behavior automatically:
- Website page visits
- Email opens and clicks
- Call duration and outcome
- Text message responses
- Appointment scheduling and changes
The more engagement data you capture, the more accurate your behavioral scoring becomes.
Factor 3: Property/Demographic Scoring
Who the lead is and what they own predicts deal size and conversion.
| Factor | Why It Matters | Suggested Points |
|---|---|---|
| Home value >$500K | Higher project budgets | +15 |
| Home value >$300K | Above-average budgets | +10 |
| Home age >20 years | More likely to need service | +10 |
| Owner-occupied | Decision-maker is present | +10 |
| Previous customer | Established relationship | +15 |
| Renter | Can't authorize major work | -15 |
| Commercial property | Different sales cycle | Variable |
Enrichment sources for property data:
- Public property records (Zillow, county assessor)
- Data enrichment services
- Customer-provided information
- Service history in your CRM
Factor 4: Need/Project Scoring
What they need indicates deal value and urgency.
| Service Type | Typical Ticket | Urgency | Suggested Points |
|---|---|---|---|
| System replacement | $8,000-15,000 | Variable | +25 |
| Major repair | $1,500-5,000 | Often urgent | +20 |
| No heat/AC emergency | $500-2,000 | Urgent | +20 |
| Maintenance agreement | $200-500/year | Recurring | +15 |
| Tune-up | $100-200 | Scheduled | +5 |
| "Just a quote" | Unknown | Low | -5 |
| "Getting multiple bids" | Unknown | Competitive | -5 |
Negative scoring indicators:
Some lead behaviors predict low conversion:
| Indicator | Points |
|---|---|
| "What's your cheapest option?" | -15 |
| "I'm calling everyone" | -10 |
| "I'm not the homeowner" | -20 |
| "Just want a price over the phone" | -10 |
| Budget stated below your minimum | -20 |
Implementing Lead Scoring in Your CRM
Manual scoring doesn't scale. Automate it.
Setting Up Automated Scoring
Step 1: Define your scoring criteria
Document every factor and its point value:
- Source factors
- Behavioral triggers
- Property/demographic criteria
- Need/project indicators
Step 2: Configure CRM fields
Ensure your CRM captures the data you need:
- Lead source (required dropdown, not free text)
- Service needed (standardized options)
- Property data fields
- Behavioral tracking enabled
Step 3: Create scoring rules
Most CRMs support rule-based scoring:
IF source = "referral" THEN score += 25
IF service_needed = "replacement" THEN score += 25
IF responded_to_followup = true THEN score += 10
Step 4: Set score thresholds
Define what scores mean:
| Score Range | Priority | Action |
|---|---|---|
| 50+ | Hot | Immediate call, assign to top closer |
| 30-49 | Warm | Same-day follow-up |
| 15-29 | Cool | Standard follow-up sequence |
| <15 | Cold | Automated nurture only |
Step 5: Create priority queues
Route leads automatically based on score:
- Hot leads → alert to sales manager + top rep
- Warm leads → standard sales queue
- Cool leads → nurture campaign
- Cold leads → marketing database
Integration with Your Sales Process
Lead scoring should change behavior, not just display numbers.
Sales team workflow:
- New lead arrives
- System calculates initial score
- Score determines routing and SLA:
- Hot: 5-minute response target
- Warm: 1-hour response target
- Cool: Same-day response target
- Score updates as behaviors occur
- Promotions and demotions trigger alerts
Manager visibility:
- Dashboard showing leads by score tier
- Alerts when hot leads go uncontacted
- Reports on conversion rate by score range
- Pipeline weighted by lead score
Calibrating and Improving Your Model
Lead scoring isn't set-it-and-forget-it. Refine based on results.
Validation Process
Monthly review:
- Pull all leads from previous month
- Segment by score tier (hot/warm/cool/cold)
- Calculate conversion rate per tier
Expected results:
| Score Tier | Target Conversion Rate |
|---|---|
| Hot (50+) | 40-60% |
| Warm (30-49) | 25-40% |
| Cool (15-29) | 10-25% |
| Cold (<15) | 5-15% |
If conversion rates don't follow this pattern, your scoring model needs adjustment.
Common Calibration Problems
Problem 1: Hot leads don't convert better than warm
Your "hot" criteria may not actually predict conversion. Review which factors are assigned high points and verify they correlate with closed deals.
Problem 2: Too many leads in one tier
If 80% of leads score "warm," you're not differentiating. Add more scoring factors or widen point ranges.
Problem 3: Scores don't change over time
If leads stay at their initial score, you're missing behavioral data. Ensure engagement tracking is configured and updating scores.
Problem 4: Sales team ignores scores
Either scores don't reflect reality (fix the model) or team isn't trained (fix the process). Both require attention.
A/B Testing Scoring Changes
When adjusting your model, test changes before full rollout:
- Split leads into test and control groups
- Apply new scoring to test group only
- Compare conversion rates after 30-60 days
- Adopt changes that improve results
Advanced Lead Scoring Techniques
Once basic scoring works, add sophistication.
Predictive Lead Scoring
Machine learning models analyze your historical data to identify patterns humans miss.
How it works:
- System analyzes all closed deals
- Identifies characteristics that correlate with conversion
- Automatically weights factors based on actual results
- Continuously refines as new data accumulates
When to consider predictive scoring:
- You have 1,000+ historical leads with outcomes
- Manual scoring model has plateaued
- You want to remove human bias from scoring
- Your CRM supports predictive features (or integrates with tools that do)
Decay Scoring
Leads that don't engage should lose points over time.
Decay rules:
| Inactivity Period | Score Adjustment |
|---|---|
| 7 days no response | -5 points |
| 14 days no response | -10 points |
| 30 days no response | Move to nurture |
| 90 days no response | Archive lead |
Decay prevents old leads from clogging your priority queues.
Negative Scoring
Actively subtract points for disqualifying behaviors:
| Disqualifying Factor | Points |
|---|---|
| Unsubscribed from email | -20 |
| Marked your call as spam | -30 |
| Job outside service area | -50 |
| Bounced email address | -15 |
| Wrong phone number | -15 |
Negative scoring quickly identifies leads not worth pursuing.
Score-Based Automation
Trigger automated actions based on score thresholds:
| Score Event | Automated Action |
|---|---|
| Lead crosses 50 | Alert top closer, create priority task |
| Lead drops below 20 | Remove from active queue, add to nurture |
| Lead hits -10 | Mark as disqualified, archive |
| Behavioral bump +15 | Re-engage with direct outreach |
Lead Scoring by Trade
Different home service trades may weight factors differently.
HVAC Lead Scoring Adjustments
| Factor | HVAC-Specific Weighting |
|---|---|
| Emergency service request | +25 (HVAC emergencies close fast) |
| System age >15 years | +15 (replacement candidate) |
| Summer/winter season | +10 (seasonal urgency) |
| Maintenance agreement inquiry | +15 (high lifetime value) |
Plumbing Lead Scoring Adjustments
| Factor | Plumbing-Specific Weighting |
|---|---|
| Water emergency | +30 (immediate need) |
| Remodel project | +20 (high ticket) |
| Water heater inquiry | +15 (replacement likely) |
| Drain cleaning | +5 (lower ticket, diagnostic upsell) |
Roofing Lead Scoring Adjustments
| Factor | Roofing-Specific Weighting |
|---|---|
| Storm damage inquiry | +25 (insurance work) |
| Roof age >20 years | +20 (replacement candidate) |
| Recent home purchase | +15 (inspection may reveal needs) |
| "Just getting quotes" | -15 (more competitive) |
Measuring Lead Scoring ROI
Prove the value of your lead scoring investment.
Key metrics to track:
| Metric | Before Scoring | After Scoring | Goal |
|---|---|---|---|
| Lead response time (hot leads) | X minutes | Y minutes | 50%+ improvement |
| Conversion rate (overall) | X% | Y% | 20-40% improvement |
| Sales team productivity | X deals/rep/month | Y deals/rep/month | 25%+ improvement |
| Cost per acquisition | $X | $Y | 15-25% reduction |
| Average deal size | $X | $Y | 10-20% increase |
ROI calculation:
- Calculate additional closed deals attributable to better prioritization
- Multiply by average deal value
- Subtract cost of scoring system (CRM features, setup time)
- Divide by cost to get ROI ratio
Most home service companies see 3-5x ROI on lead scoring within 6 months.
Frequently Asked Questions
How many leads do I need before lead scoring makes sense?
You can implement basic lead scoring with as few as 50-100 leads per month. The model will be simple (source + service type), but it's better than no prioritization. More sophisticated scoring requires 500+ leads with outcome data to validate which factors actually predict conversion.
What if my sales team pushes back on lead scores?
Two common causes: scores don't reflect reality (fix the model) or team doesn't trust the system (demonstrate results). Start by showing correlation between high scores and closed deals using your own data. Let skeptics track their own results against predictions. Most resistance fades when scores prove accurate.
Should I hide low scores from leads?
Never share scores externally—they're internal prioritization tools. Even low-score leads deserve professional treatment; they just receive less high-touch investment. An automated nurture campaign for low-score leads can still convert them over time without consuming sales team hours.
Start Scoring Your Leads
Lead scoring transforms chaotic lead management into systematic prioritization. Your best opportunities get immediate attention. Your team focuses effort where it converts. Your close rates improve without adding headcount.
Key takeaways for home service businesses:
- Score leads on source, behavior, property, and need factors
- Automate scoring in your CRM for consistency
- Set clear thresholds that trigger different actions
- Validate and refine your model monthly
- Expect 30-40% improvement in conversion rates
Start simple. Score on source and service type. Add behavioral factors as your tracking matures. Refine based on actual conversion data.
The goal isn't a perfect model—it's a better-than-gut-feeling model that improves over time.
Ready to implement lead scoring in your home service business? Start your free trial with TruLine and see your leads automatically prioritized by conversion potential.


